Filters
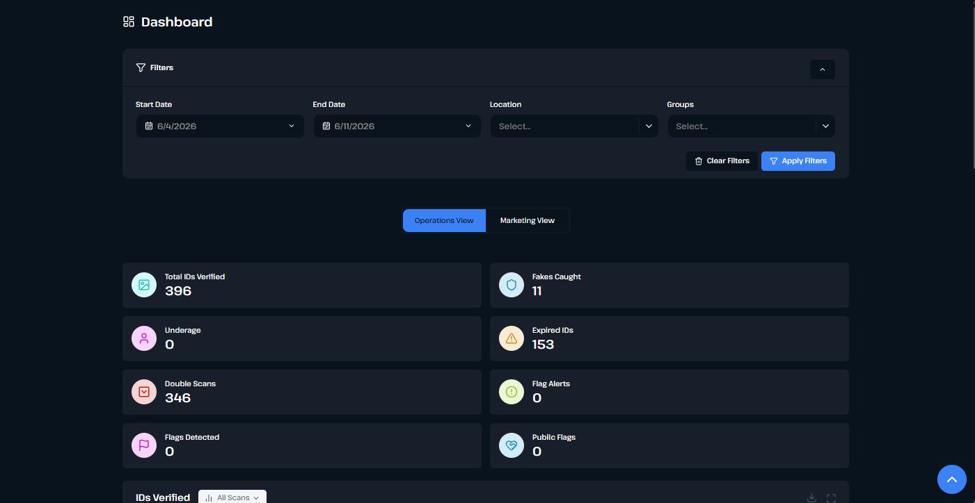
Use the filters at the top of the page to define the data range shown across the entire dashboard. Click Apply Filters to update or Clear Filters to reset.
|
Filter |
Description |
|
Start Date / End Date |
Define the date range for all dashboard data. |
|
Location |
Filter data by a specific venue location. |
|
Groups |
Filter data by patron group. |
Operations View
The Operations View displays security-focused metrics for the selected date range:
|
Metric |
Description |
|
Total IDs Verified |
Total number of IDs scanned within the selected date range. |
|
Fakes Caught |
Number of fraudulent IDs detected. |
|
Underage |
Number of patrons identified as underage. |
|
Expired IDs |
Number of IDs that were expired at time of scan. |
|
Double Scans |
Number of IDs that were scanned more than once. |
|
Flag Alerts |
Number of scans that triggered an existing flag alert. |
|
Flags Detected |
Total number of flagged patrons detected during scans. |
|
Public Flags |
Number of flags with public visibility detected. |
Charts & Data Tables
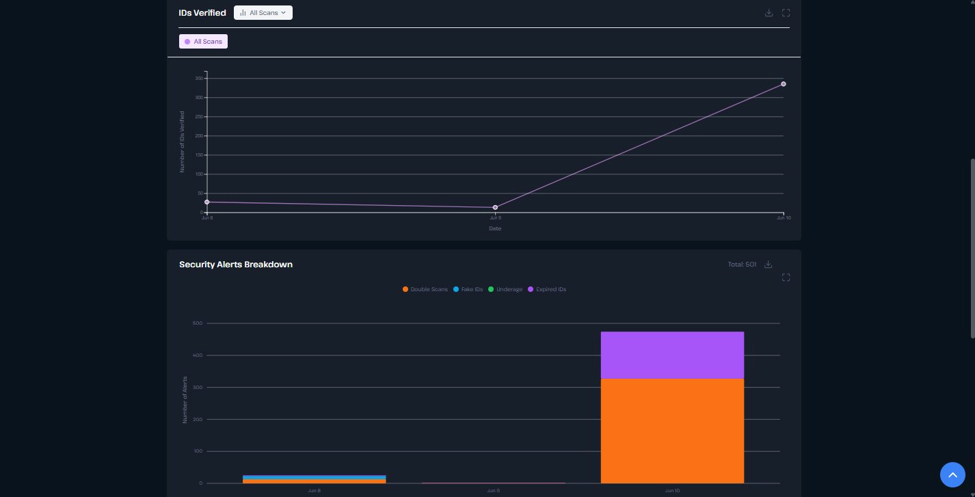
Below the metric tiles, the dashboard displays a series of charts and data tables that visualize scan and alert trends over the selected period. Charts can be downloaded or expanded using the icons in their top-right corner.
|
Chart |
Description |
|
IDs Verified |
Line graph showing scan volume over time. Toggle between All Scans or filter by scan type. |
|
Security Alerts Breakdown |
Stacked bar chart showing alerts by type (Double Scans, Fake IDs, Underage, Expired IDs) over the selected period. |
|
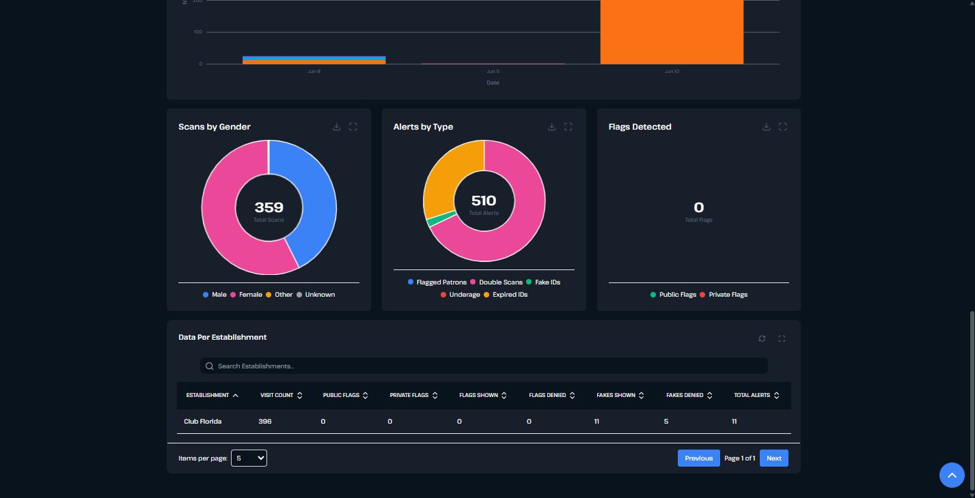
Scans by Gender |
Donut chart showing total scans broken down by gender (Male, Female, Other, Unknown). |
|
Alerts by Type |
Donut chart showing total alerts broken down by type (Flagged Patrons, Double Scans, Fake IDs, Underage, Expired IDs). |
|
Flags Detected |
Donut chart showing total flags broken down by Public and Private. |
|
Data Per Establishment |
Table showing visit count, flag counts, fakes shown/denied, and total alerts per venue location. |
Marketing View
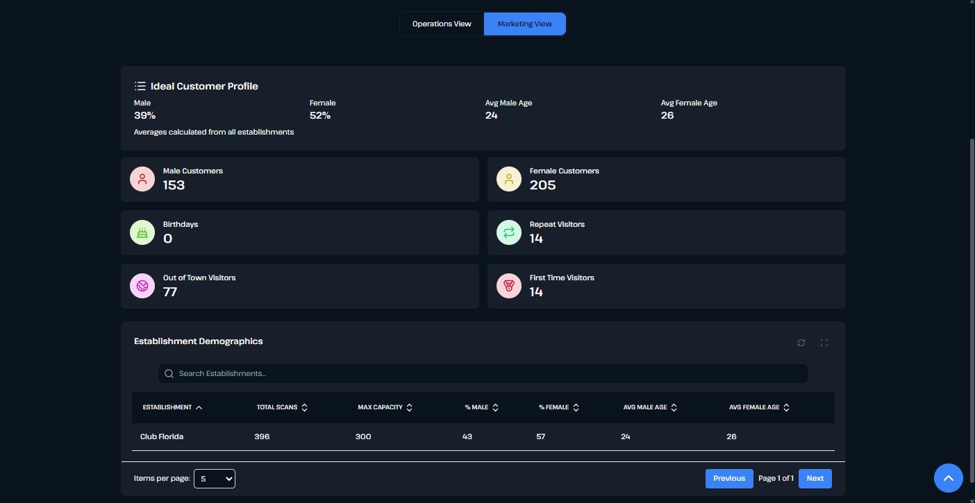
Switch to Marketing View to access patron demographic data:
|
Metric |
Description |
|
Ideal Customer Profile |
Shows average gender split and age across all establishments. Averages are calculated from all locations. |
|
Male / Female Customers |
Count of male and female patrons scanned in the selected period. |
|
Birthdays |
Number of patrons whose birthday falls within the selected date range. |
|
Repeat Visitors |
Number of patrons who have visited more than once. |
|
Out of Town Visitors |
Number of patrons whose ID address is outside the local area. |
|
First Time Visitors |
Number of patrons visiting for the first time. |
|
Establishment Demographics |
A breakdown table showing total scans, max capacity, and gender/age averages per location. |